The vault that thinks — now the vault that governs.
In v3 the Second Brain is not just where knowledge lives — it's where the fleet's own structure lives. The nine resort charters, the loop graph, the kill-switch registry and the doctrine every agent runs against are all markdown files in the same three-layer graph: versioned, wikilinked, audited weekly.
What changed in v3: in v2 the vault held knowledge about the fleet. In v3 the vault is the fleet's structure. A knowledge store became a governance substrate.
Every note, every wikilink — visualised as a graph. Clusters emerge from the connections: projects pull in their people and tools, daily notes anchor to clippings, areas grow their own hubs. The shape of the graph is the shape of the knowledge.
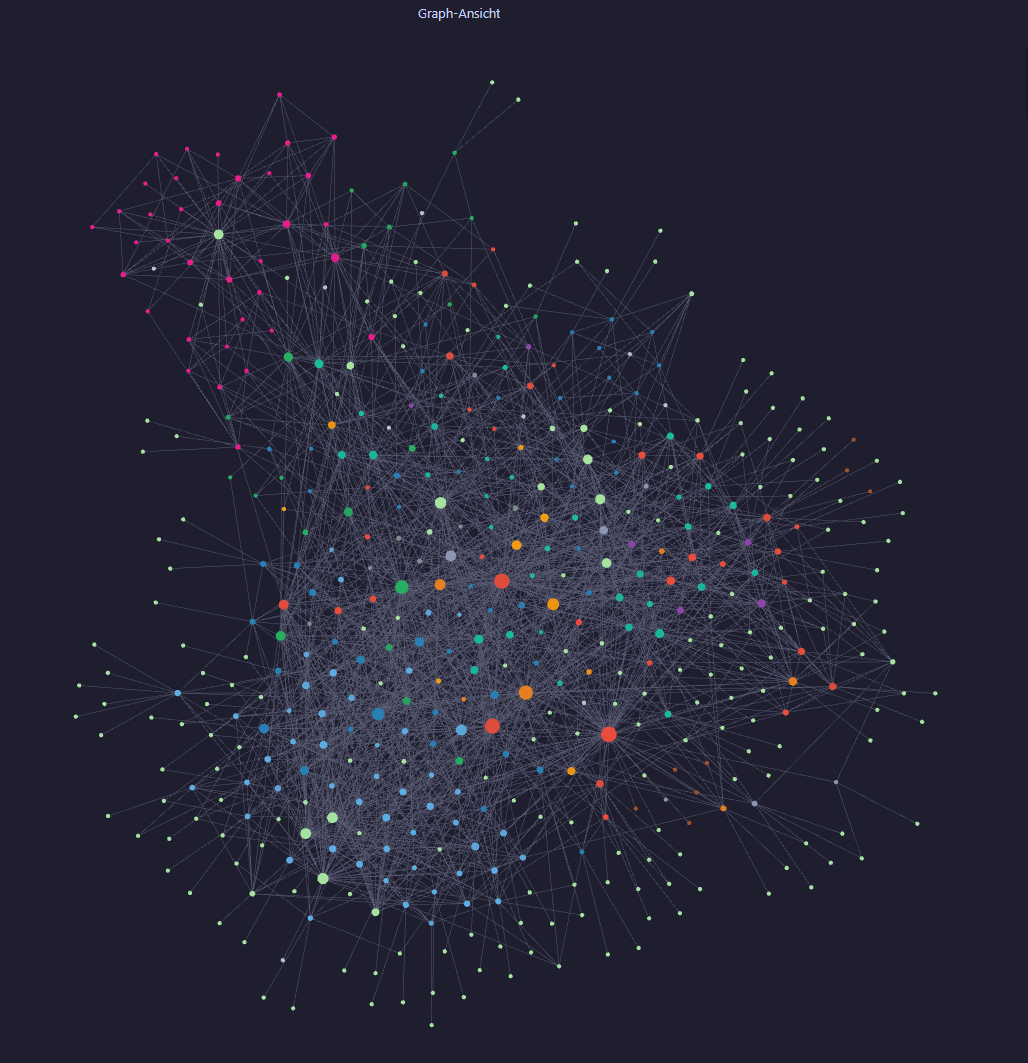
1,000+ notes · thousands of wikilinks · clusters by project, area, and person
A knowledge base
that thinks.
Hundreds of markdown notes inside Obsidian, wired together as a graph of wikilinks. Every person, project, tool and idea is one click away from the next. The agent fleet reads it, edits it, and grows it daily.
Three layers, one navigable graph.
A discipline borrowed from the LLM-Wiki pattern: separate raw sources from synthesised wiki pages, and protect the rules that govern both. Every note belongs to exactly one layer.
The state of the whole system on one screen: today's KPIs, the fleet's task queue, weekly goals by track, vault health, and recent activity. It reads Emi's own live data, so every refresh is a current snapshot.
New in v2: the old static dashboard, rebuilt once per session, became Mission Control — a live cockpit that reads the fleet's own data continuously. Demo data shown below for privacy.
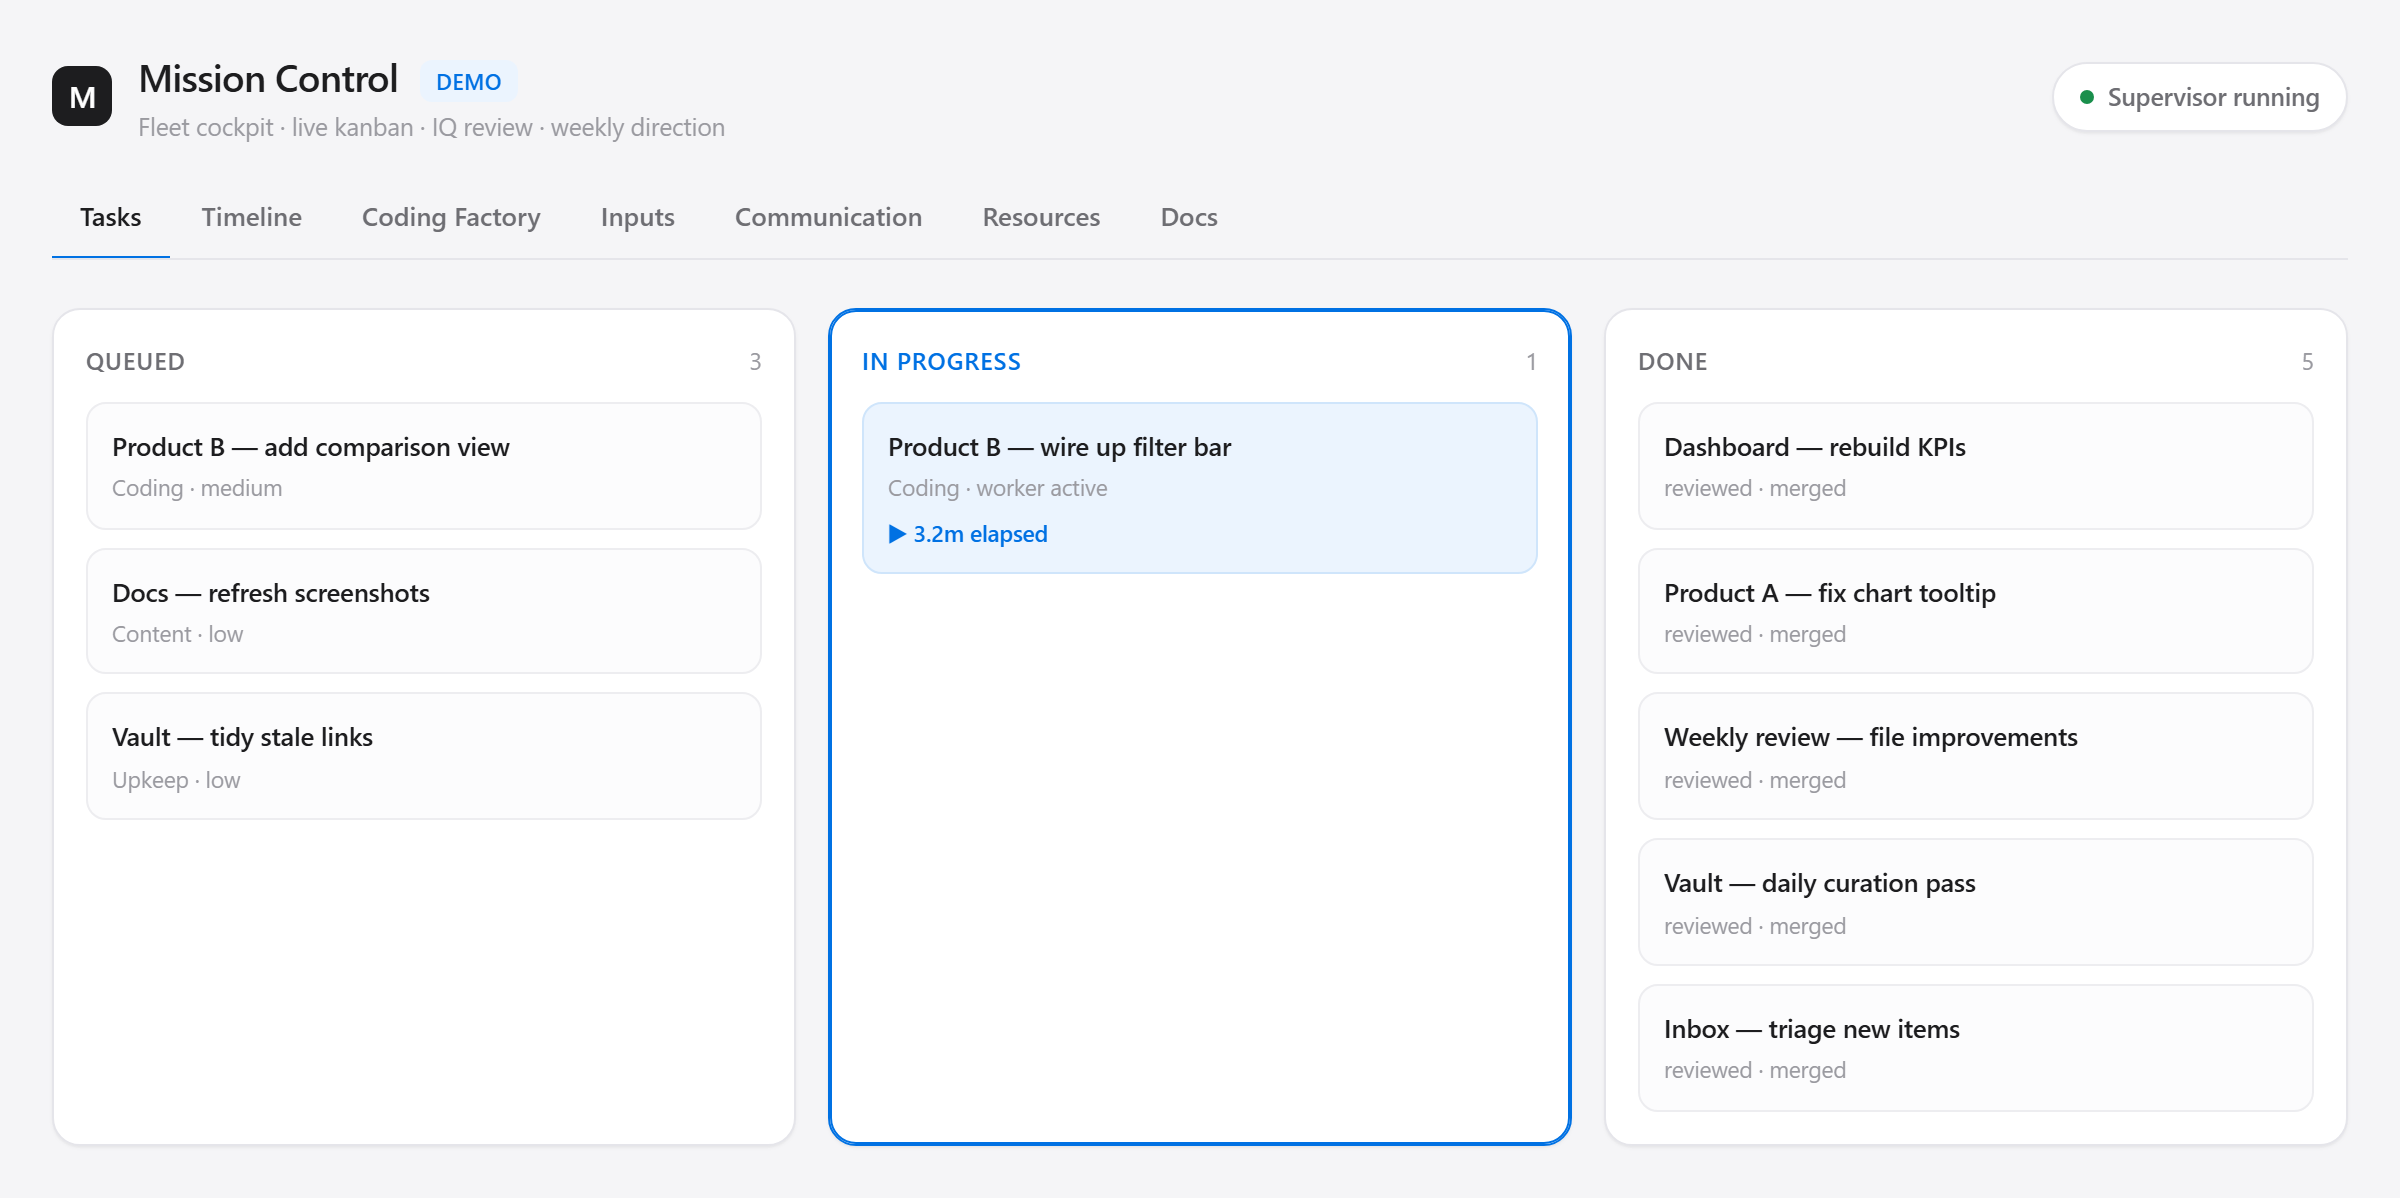
Mission Control · the fleet's live kanban · private to Michael · demo data shown — the real cockpit is access-locked
Every note, every wikilink — visualised as a graph. Clusters emerge from the connections: projects pull in their people and tools, daily notes anchor to clippings, areas grow their own hubs. The shape of the graph is the shape of the knowledge.
862 notes · 9,600+ edges · 103 days · clusters by project, area, and person
A knowledge base
that thinks.
Hundreds of markdown notes inside Obsidian, wired together as a graph of wikilinks. Every person, project, tool and idea is one click away from the next. The agent fleet reads it, edits it, and grows it daily.
Three layers, one navigable graph.
A discipline borrowed from the LLM-Wiki pattern: separate raw sources from synthesised wiki pages, and protect the rules that govern both. Every note belongs to exactly one layer.
A self-built dashboard rebuilt every session: today's KPIs, vault health, learning feed, recent clippings, daily-note summaries, orphan-note detection, project lifecycle states. One page that tells Michael — or any agent — the state of Emi in 30 seconds.
Live at session-start · regenerated by the Vault Curator agent · zero token cost (pure file scan) · demo data — Michael's real vault is redacted for privacy
Every note, every wikilink — visualised as a graph. Clusters emerge from the connections: projects pull in their people and tools, daily notes anchor to clippings, areas grow their own hubs. The shape of the graph is the shape of the knowledge.
539 notes · 5,326 edges · 55 days · clusters by project, area, and person